Microsoft Exchange is an email server solution that is used by many organizations. It is vital that the Exchange server works properly and available all the time for seamless user experience and uninterrupted workflow in the organization. In this aspect, it becomes important for administrators to regularly monitor the Exchange server so as to ensure that it is in good health and performs properly. If the server doesn’t perform well, it can impact the organization’s mission-critical tasks and hamper the productivity.
There are are many built-in mechanisms in Microsoft Exchange to check server activities. However, an automated Exchange monitor tool can be of great help in tracking and monitoring all these activities in a hassle-free way. You have a wide range of top Exchange server monitoring tools to choose from. So, it is difficult to pick the best Exchange server monitor tool that can meet your requirements. Here, we have mentioned top 5 Exchange monitoring tools, detailing their features, strengths and limitations, so as to help you in selection.
Following are the top Exchange monitoring tools:
1. Stellar Reporter & Auditor for Exchange Server
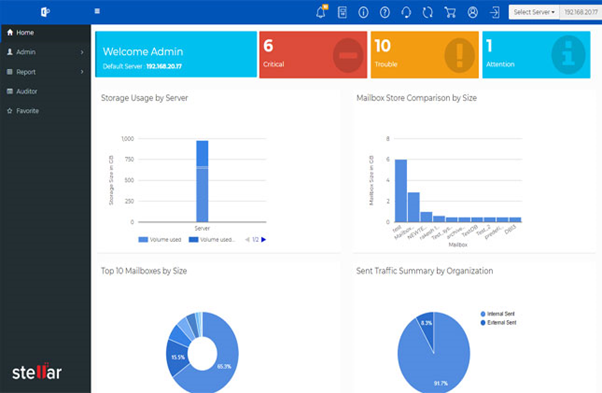
Stellar Reporter & Auditor for Exchange Server is an advanced Exchange monitor tool that allows you to fetch and analyze almost every Exchange server parameter. It has a simple but resourceful UI that helps generate custom reports and gain insights into the server. So, it is the best Exchange server monitor tool for administrators who seek simplicity and quality in Exchange monitoring. The application can generate 142 different reports on almost every aspect of Exchange server. It also supports multiple Exchange servers on the same network.
You can use Stellar Reporter & Auditor software to:
- Create detailed graphical reports of Exchange server. You can generate mailbox login reports, user logon activity reports, mailbox permission changes reports, mounted properties changes reports, etc.
- Audit changes in Exchange server. You can view changes in mailbox permissions, storage quota, non-owner mailbox access, etc.
- Schedule scanning and reporting to automate Exchange monitoring.
- Configure and send Exchange Server alerts automatically via emails.
- Get quick insights into the Exchange server on the Welcome Admin Page. You can get insights into storage usage of server, number of alerts, server occupancy in graphical form, internal & external emails, etc.
- Access Admin Navigation menu that offers different functions for server management such as adding, editing, and scanning server, edit existing tasks, etc.
- Monitor Exchange server remotely (even on a smartphone) and avail 24X7 reporting.
Free Trial: 60 days
| Pros | Cons |
| 142 different reports | Limited UI customization options |
| User-friendly interface and controls | |
| Remote Exchange monitoring | |
| Advanced Exchange scanning and task scheduling | |
| Real-time surveillance of modifications & activities | |
| Exports reports to different formats – CSV, PDF, XLSX, & HTML | |
2. ManageEngine OpManager
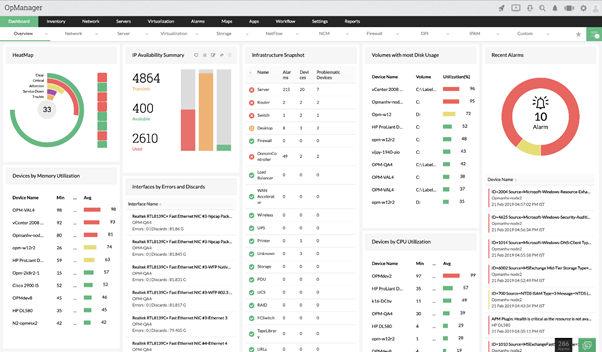
ManageEngine OpManager is a network monitoring solution you can deploy to monitor Exchange server performance. It offers an intuitive user interface and a wide range of pre-defined reports. You can create custom reports as well. The software is available for both Windows and Linux.
You can use ManageEngine OpManager to:
- Monitor server availability and health with over 300 performance metrics.
- Identify and remove inactive mailboxes from the server to boost performance.
- Monitor Exchange queues and connections to identify performance-impacting bottlenecks early on.
- Troubleshoot Outlook connectivity issues by reviewing different parameters such as average response time, number of requests per second, etc.
Free Trial: 30 days
| Pros | Cons |
| Intuitive UI | Irregular software updates |
| Easy troubleshooting of issues | Network knowledge required |
| Physical and virtual server monitoring | |
| Customizable dashboard | |
3. SolarWinds Server & Application Monitor
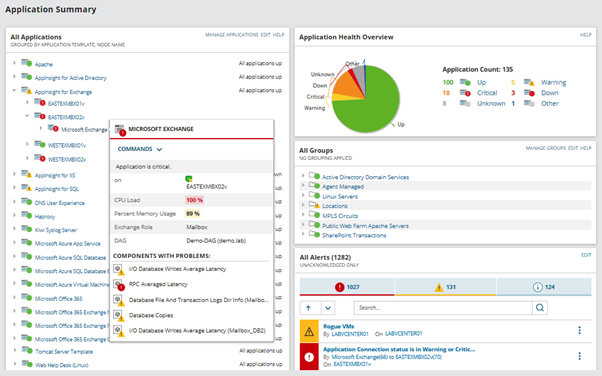
SolarWinds Server & Application Monitor is one of the top Exchange server monitoring tools you can use. You can use it as an Exchange server health monitor and Exchange event log monitor. The application is easy to set up and offers excellent visibility of entire Exchange infrastructure.
You can use SolarWinds Server & Application Monitor to:
- Monitor Exchange server performance across your private, public, and hybrid cloud environments.
- Identify and troubleshoot Active Directory issues.
- Monitor virtual, cloud, web, and remote hosts to optimize server performance.
- Identify and resolve response time issues to boost the performance of slow servers.
- Prevent mail storms and other issues by monitoring mailbox server, hub transport server, edge transport server, etc.
- Plan mailbox database availability by setting up alerts for database usage and available free space.
- Identify issues with input/output operations per second (IOPS) or volume capacity in advance by reviewing storage metrics with present and older data.
Free Trial: 30 days
| Pros | Cons |
| Highly customizable | Setting up alerts and baselines is tedious |
| Creates granular alerts for each trigger | No option to simplify data and reports |
| Supports custom server monitoring with WMI, SNMP, and PowerShell scripts | |
| Centralized IT asset inventory management | |
4. Nagios XI
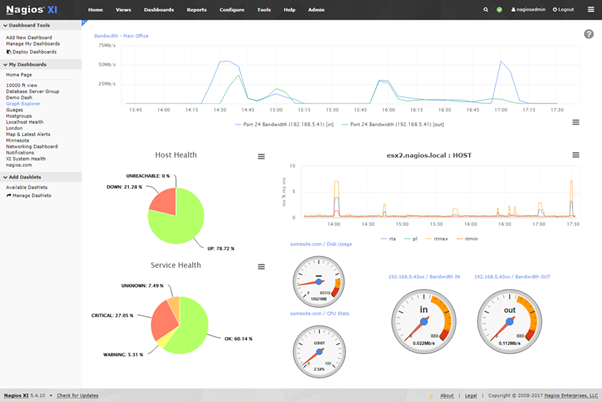
Nagios XI is a comprehensive enterprise server and network monitoring application. You can use it as an Exchange event log monitor and to analyze server performance metrics, applications, and services. This utility supports third-party add-ons and allows you to customize the GUI as well.
With Nagios XI tool, you can:
- Receive reports of Exchange alerts, notifications, outages, etc.
- Monitor applications, services, operating systems, system metrics, network protocols, and more.
- Receive alerts directly via email or SMS.
- Get a centralized view of complete Exchange infrastructure through a web interface.
- Deploy multi-user access to IT staff for Exchange monitoring.
- Set user-specific views to maintain security.
- Enhance and simplify Exchange monitoring with hundreds of add-ons and APIs.
Free Trial: 30 days
| Pros | Cons |
| Highly customizable | Poor UI |
| Offers agentless and agent monitoring | Difficult to set up |
| Good cost-value balance | |
| SNTP Protocol use is excellent | |
| Extensive plugin directory | |
5. Foglight for Exchange
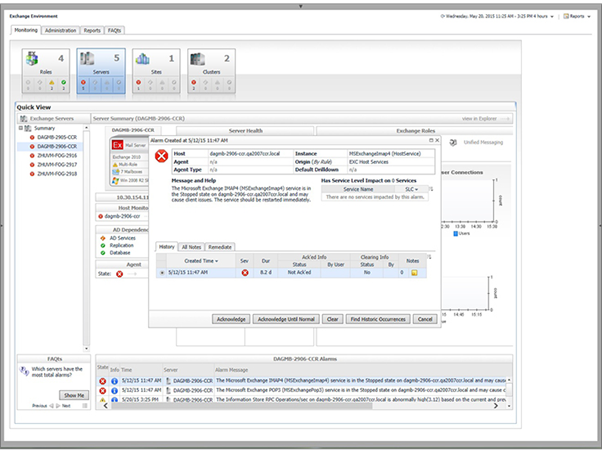
If you seek a reliable and user-friendly application to monitor Exchange server performance, you can pick Foglight for Exchange. This Exchange monitoring tool allows you to identify and resolve server load issues, schedule diagnostic reports, classify top users to pinpoint load issues, and more.
With Foglight for Exchange, you can:
- Check abnormal data flows and critical load areas.
- Monitor Exchange health by observing individual Exchange components with logical representations.
- Monitor both cloud-based and on-premises mailboxes through a single interface.
- Quickly identify the problem areas with your physical and virtual environment.
Free Trial: 30 days
| Pros | Cons |
| Neat and refined dashboard | No APM capabilities |
| Setting up alerts is simple | Complex GUI |
| Supports custom scripts | Poor responsive time on some occasions |
| VMWare Monitoring | |
| Remote monitoring for Windows and Linux | |
Conclusion
To ensure proper working and good health of your MS Exchange server, you must regularly monitor Exchange server performance. Managing mailboxes, data stores, and users on Exchange server can be a challenging task. For quick and automated tracking of such activities, you can use an advanced Exchange monitoring software. However, it’s difficult to find an Exchange server monitoring tool that is suitable for your particular requirements. To make this decision easier, we’ve mentioned the top Exchange server monitoring tools in this post. You can install the free trial version of these software to explore their features and test their functionality.
Was this article helpful?